

What is a KPI Dashboard?
Definition:
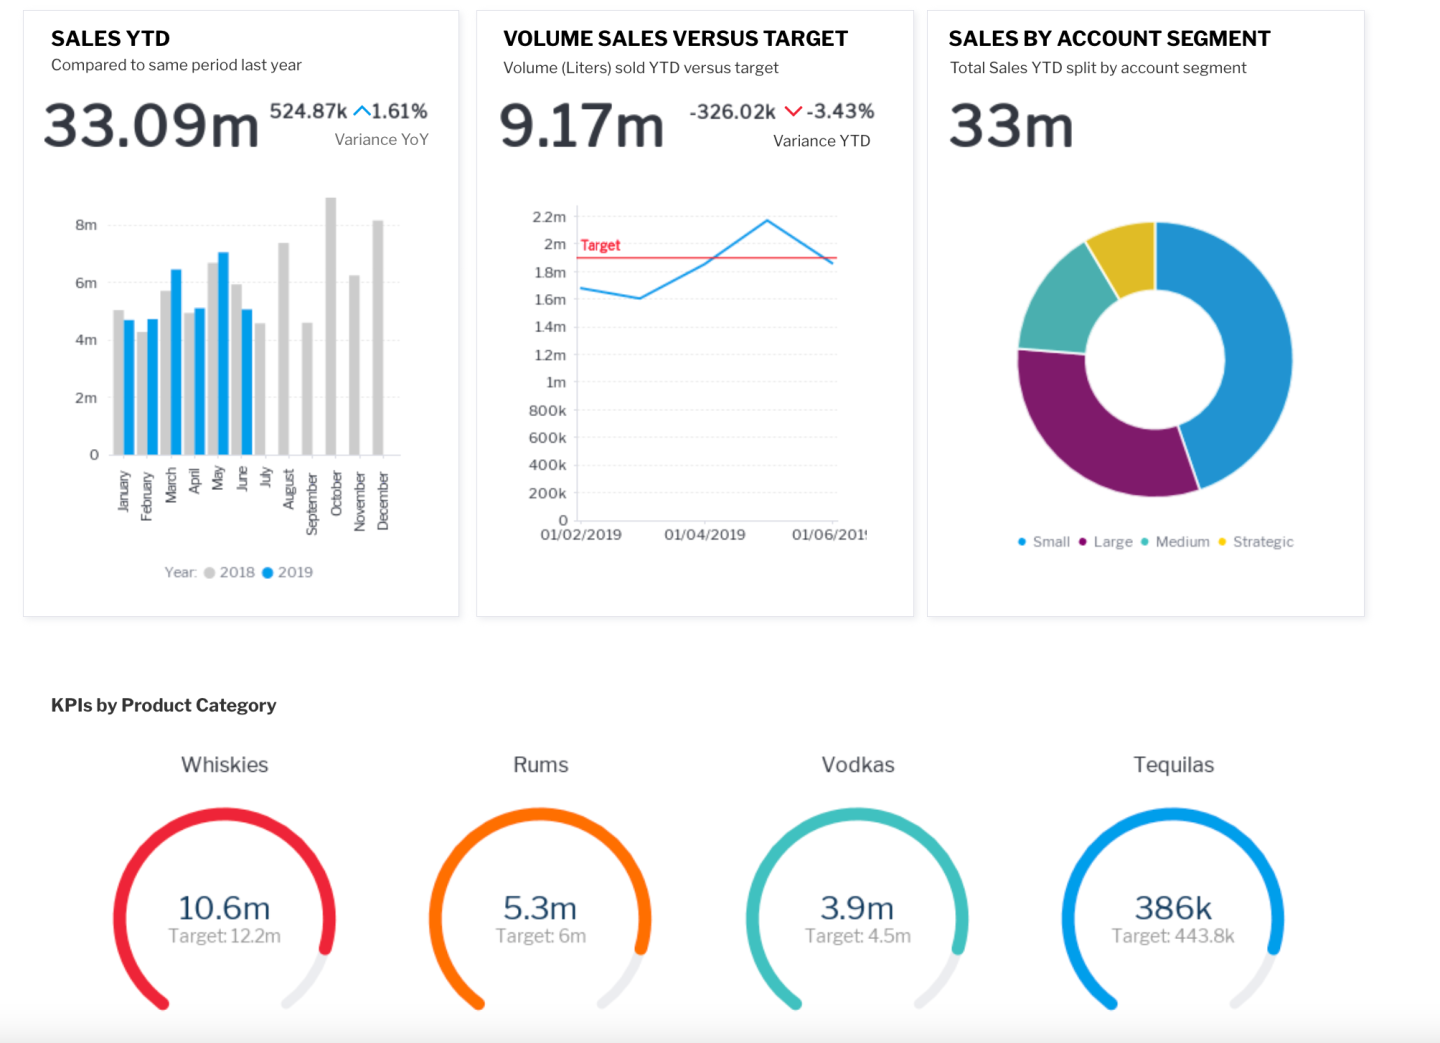
A KPI (Key Performance Indicator) Dashboard is a visual representation of essential metrics and performance indicators that allows businesses to monitor, analyze, and track their key goals and objectives. It serves as a centralized hub for displaying real-time or periodic data, providing a quick and comprehensive overview of an organization’s performance against predefined benchmarks. KPI dashboards are instrumental in facilitating data-driven decision-making by presenting critical information in an accessible and visually appealing format.
Analogy:
Think of a KPI Dashboard as the instrument panel of a car. Much like a driver relies on the dashboard to assess speed, fuel levels, and other vital information, businesses use KPI dashboards to monitor key metrics and make informed decisions about their performance and strategies.
Further Description:
KPI dashboard development involves several crucial elements:
Identifying Key Metrics: Determine the most relevant KPIs based on organizational goals. These could include financial metrics, customer satisfaction scores, sales performance, website traffic, or any other indicators critical to success.
Data Integration: Gather and integrate data from various sources, such as databases, analytics tools, and other software platforms, to provide a comprehensive and accurate representation of performance.
Visualization Techniques: Employ effective data visualization techniques, such as charts, graphs, and gauges, to make complex data easily understandable. Clear visualizations enhance the ability to identify trends, patterns, and outliers.
Customization: Tailor the KPI dashboard to meet the specific needs of different stakeholders within the organization. Customization allows different teams to focus on the metrics most relevant to their responsibilities.
Real-time Updates: Implement mechanisms for real-time or near-real-time updates to ensure that the dashboard reflects the most current data. This feature is particularly valuable for agile decision-making.
User Accessibility: Design the dashboard with user-friendly interfaces, ensuring that it is easily accessible to various team members, from executives to front-line employees.
Mobile Responsiveness: In an era of remote work and on-the-go decision-making, a mobile-responsive KPI dashboard allows users to access critical data anytime, anywhere.
Why is a KPI Dashboard Important?
Performance Monitoring: KPI dashboards provide a centralized platform for tracking and monitoring the performance of key business metrics, allowing stakeholders to assess progress toward goals.
Data-Driven Decision-Making: By presenting data in a visually digestible format, KPI dashboards empower organizations to make informed, data-driven decisions quickly and efficiently.
Goal Alignment: KPI dashboards help ensure that teams and departments are aligned with overall organizational goals, fostering a cohesive approach to success.
Efficiency and Productivity: Access to real-time data in a visually intuitive format enhances efficiency and productivity by reducing the time spent gathering and analyzing information.
Proactive Problem Identification: The visual nature of KPI dashboards facilitates the early identification of issues or trends, allowing organizations to address challenges proactively.
Examples and Usage:
Google Analytics Dashboard: Google Analytics provides a comprehensive dashboard for web analytics, allowing users to track website traffic, user behavior, and other key metrics.
Salesforce Dashboard: Salesforce offers customizable dashboards for tracking sales performance, customer interactions, and various business processes.
Tableau Dashboard: Tableau is a powerful data visualization tool that enables the creation of interactive and dynamic dashboards for analyzing and interpreting data.
Key Takeaways:
- Identify and prioritize key metrics aligned with organizational goals for inclusion in the KPI dashboard.
- Integrate data from various sources to provide a comprehensive and accurate representation of performance.
- Use effective data visualization techniques to make complex information easily understandable.
- Customize the dashboard to meet the specific needs of different stakeholders within the organization.
- Implement real-time updates and ensure mobile responsiveness for agile decision-making.
- A KPI dashboard is essential for performance monitoring, data-driven decision-making, goal alignment, and proactive problem identification.
- Incorporate examples like Google Analytics, Salesforce, and Tableau to illustrate real-world applications of KPI dashboards.
- A KPI dashboard is like the instrument panel of a car, providing a quick and comprehensive overview of an organization’s performance against predefined benchmarks.

