When it comes to developing iOS apps, performance is paramount. Users expect snappy, responsive experiences, and any lag or slowdown can lead to frustration and abandonment. Objective-C, one of the primary programming languages for iOS development, offers a plethora of tools and techniques to optimize app performance.
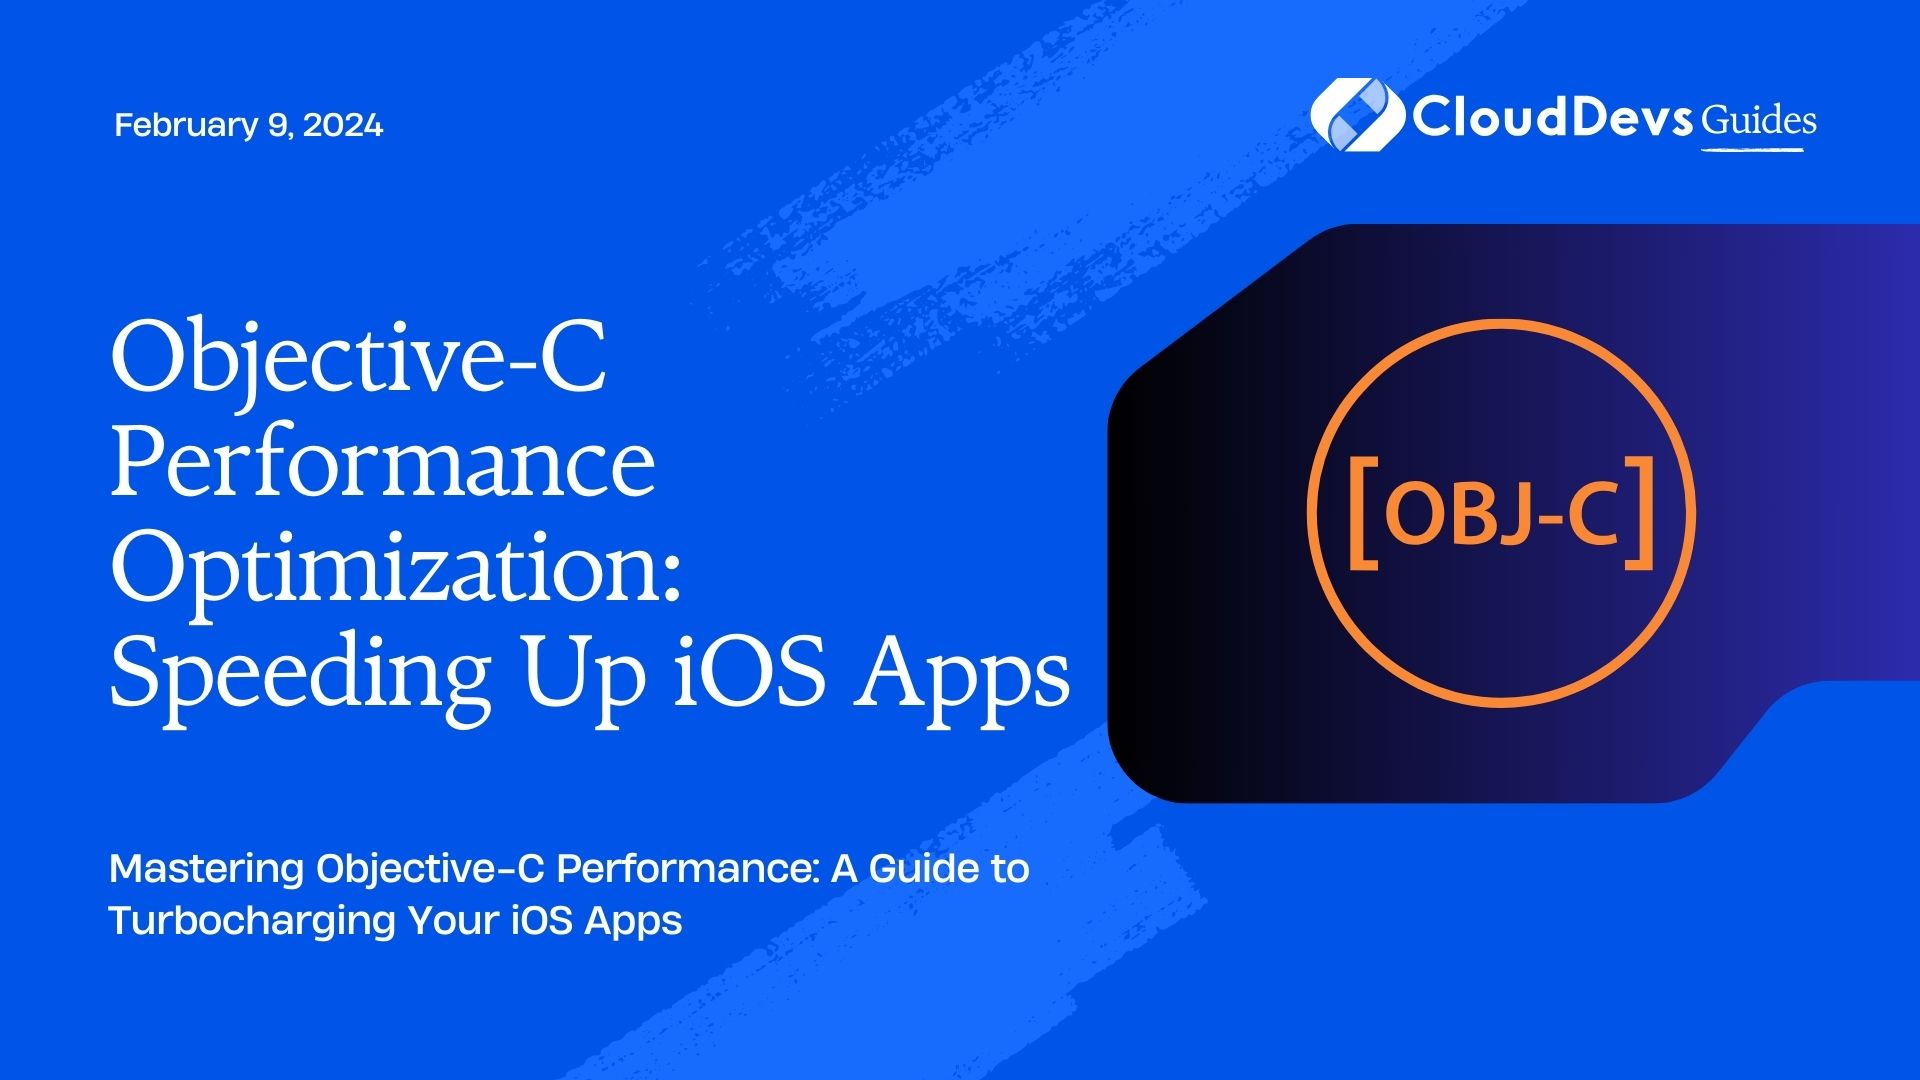
Table of Contents
In this comprehensive guide, we’ll explore various strategies and best practices for Objective-C performance optimization. Whether you’re building a new app or looking to improve the speed of an existing one, these tips and code samples will help you deliver a lightning-fast user experience.
1. Why Performance Optimization Matters
Before we dive into the specifics of Objective-C performance optimization, let’s understand why it’s so crucial for iOS apps.
1.1. User Experience
A slow and unresponsive app can quickly turn users away. With millions of apps available, users have little patience for sluggish performance. To keep users engaged and satisfied, your app needs to be fast and smooth.
1.2. App Retention
Performance directly impacts user retention. Apps that perform well are more likely to be used regularly, while slow apps are often deleted after just a few uses.
1.3. App Store Rankings
App store algorithms take performance into account when ranking apps. Well-optimized apps are more likely to be featured and promoted.
1.4. Battery Life
Inefficient code can drain a device’s battery quickly, leading to negative user reviews and decreased app usage.
Now that we understand the importance of performance optimization, let’s explore how to achieve it in Objective-C.
2. Profiling and Measurement
Before you can optimize your Objective-C app, you need to identify performance bottlenecks. Profiling and measurement tools are essential for this task.
2.1. Instruments: A Powerful Profiling Tool
Instruments is a macOS application that provides a suite of performance analysis tools. You can use Instruments to monitor various aspects of your app’s performance, such as CPU usage, memory usage, and disk I/O.
Let’s take a look at a code sample showing how to use Instruments to profile your Objective-C app:
objective
#import <Foundation/Foundation.h>

int main(int argc, const char * argv[]) {
    @autoreleasepool {
        // Code to profile goes here

        // Start profiling
        [DDPerformanceMonitor startMonitoring];

        // Your app's code

        // Stop profiling
        [DDPerformanceMonitor stopMonitoring];
    }
    return 0;
}
In this code snippet, we import the necessary framework and start and stop performance monitoring using DDPerformanceMonitor. Instruments will provide detailed information about your app’s performance, helping you pinpoint areas that need optimization.
2.2. Time Profiling
Time profiling is a crucial aspect of performance optimization. It allows you to identify which parts of your code are consuming the most time. Instruments’ Time Profiler instrument can help you visualize this data and drill down into specific functions and methods.
Here’s how you can use Time Profiler in Instruments:
- Open Xcode and go to “Xcode” > “Open Developer Tool” > “Instruments.”
- Create a new trace document and choose the “Time Profiler” instrument.
- Click the “Record” button to start profiling.
- Interact with your app to simulate real usage.
- Stop the recording and analyze the results to identify performance bottlenecks.
3. Memory Management
Memory management is another critical aspect of Objective-C performance optimization. Poor memory management can lead to memory leaks and excessive memory usage, causing your app to slow down or crash.
3.1. Automatic Reference Counting (ARC)
Objective-C introduced ARC, which automatically manages memory by adding and removing retain/release calls. ARC significantly simplifies memory management, but it’s essential to understand how it works and use it correctly.
Here’s a code snippet demonstrating ARC in action:
objective
NSString *name = [[NSString alloc] initWithFormat:@"Hello, %@", @"Objective-C"];
// Do something with 'name'
With ARC, you don’t need to worry about releasing name when you’re done with it; it will be automatically deallocated when it goes out of scope.
3.2. Avoiding Retain Cycles
Retain cycles, also known as strong reference cycles, can lead to memory leaks. They occur when two objects reference each other strongly, preventing either of them from being deallocated. To avoid retain cycles, use weak references for object relationships that should not keep each other alive.
objective
__weak typeof(self) weakSelf = self;

self.completionBlock = ^{
    // Use weakSelf to avoid a retain cycle
};
In this code snippet, weakSelf is a weak reference to self, ensuring that the completion block doesn’t keep the entire object graph alive.
3.3. Memory Profiling with Instruments
Instruments also provides memory profiling tools to help you identify memory-related issues in your Objective-C app. The “Allocations” instrument, for example, allows you to track memory allocations and deallocations, making it easier to spot memory leaks.
To use the “Allocations” instrument:
- Open Instruments.
- Create a new trace document.
- Choose the “Allocations” instrument.
- Record your app’s memory usage.
- Analyze the results to find memory leaks and excessive memory usage.
4. Code Optimization Techniques
Now that we’ve covered profiling and memory management, let’s delve into code optimization techniques specific to Objective-C.
4.1. Use Fast Enumeration for Arrays
When iterating over arrays, use fast enumeration (also known as fast enumeration) instead of traditional for loops. Fast enumeration is more efficient and results in cleaner code.
objective
NSArray *myArray = @[...];

for (id obj in myArray) {
    // Process 'obj'
}
4.2. Lazy Loading
Lazy loading is a technique where you defer the loading of resources or data until they are actually needed. This can significantly improve the startup time of your app and reduce memory usage.
objective
- (UIImage *)lazyLoadedImage {
    if (!_lazyLoadedImage) {
        _lazyLoadedImage = [UIImage imageNamed:@"myImage"];
    }
    return _lazyLoadedImage;
}
In this example, the image is only loaded the first time it’s accessed, making your app more efficient.
4.3. Reduce Method Calls
Excessive method calls can introduce overhead. Minimize the number of method calls in performance-critical sections of your code.
objective
// Inefficient
for (NSInteger i = 0; i < 1000; i++) {
    [self doSomething];
}

// More efficient
SEL doSomethingSelector = @selector(doSomething);
for (NSInteger i = 0; i < 1000; i++) {
    [self performSelector:doSomethingSelector];
}
In the second example, we reduce the overhead of method calls by using the performSelector: method.
4.4. Caching
Caching is a powerful technique to avoid redundant computations. Cache the results of expensive operations and reuse them when needed.
objective
- (NSString *)cachedResultForKey:(NSString *)key {
    NSString *cachedValue = [self.cache objectForKey:key];
    if (!cachedValue) {
        // Compute the result
        cachedValue = [self computeResultForKey:key];
        [self.cache setObject:cachedValue forKey:key];
    }
    return cachedValue;
}
In this code, we check if the result is already cached before recomputing it, which can save valuable CPU cycles.
4.5. Multithreading
Multithreading allows your app to perform tasks concurrently, improving responsiveness. However, it requires careful synchronization to avoid data races and other issues.
objective
dispatch_queue_t concurrentQueue = dispatch_get_global_queue(DISPATCH_QUEUE_PRIORITY_DEFAULT, 0);
dispatch_async(concurrentQueue, ^{
    // Perform work in the background
    dispatch_async(dispatch_get_main_queue(), ^{
        // Update the UI on the main thread
    });
});
Use Grand Central Dispatch (GCD) to manage multithreading in Objective-C. GCD simplifies concurrent programming and provides a safe and efficient way to work with multiple threads.
Conclusion
Objective-C performance optimization is a critical aspect of iOS app development. By using profiling tools like Instruments, mastering memory management, and implementing code optimization techniques, you can create apps that are fast, responsive, and energy-efficient.
Remember that optimization is an ongoing process. As your app evolves and your user base grows, you’ll need to continually monitor and improve performance. By following the best practices outlined in this guide and staying vigilant, you can deliver an exceptional user experience and keep your iOS app running at peak performance.
Start implementing these strategies today, and your users will thank you with high ratings and increased engagement. Happy coding!
Table of Contents